Host Metrics
The Metrics tab of the Hosts form gives access to a series of basic metrics and information collected by Muppy:
- Technical characteristics of the Host (CPU, RAM, disks)
- List of disk partitions with a summary of used and available space
- Disk usage notification thresholds (as a percentage of used space)
- Performance benchmarks (disk and CPU)
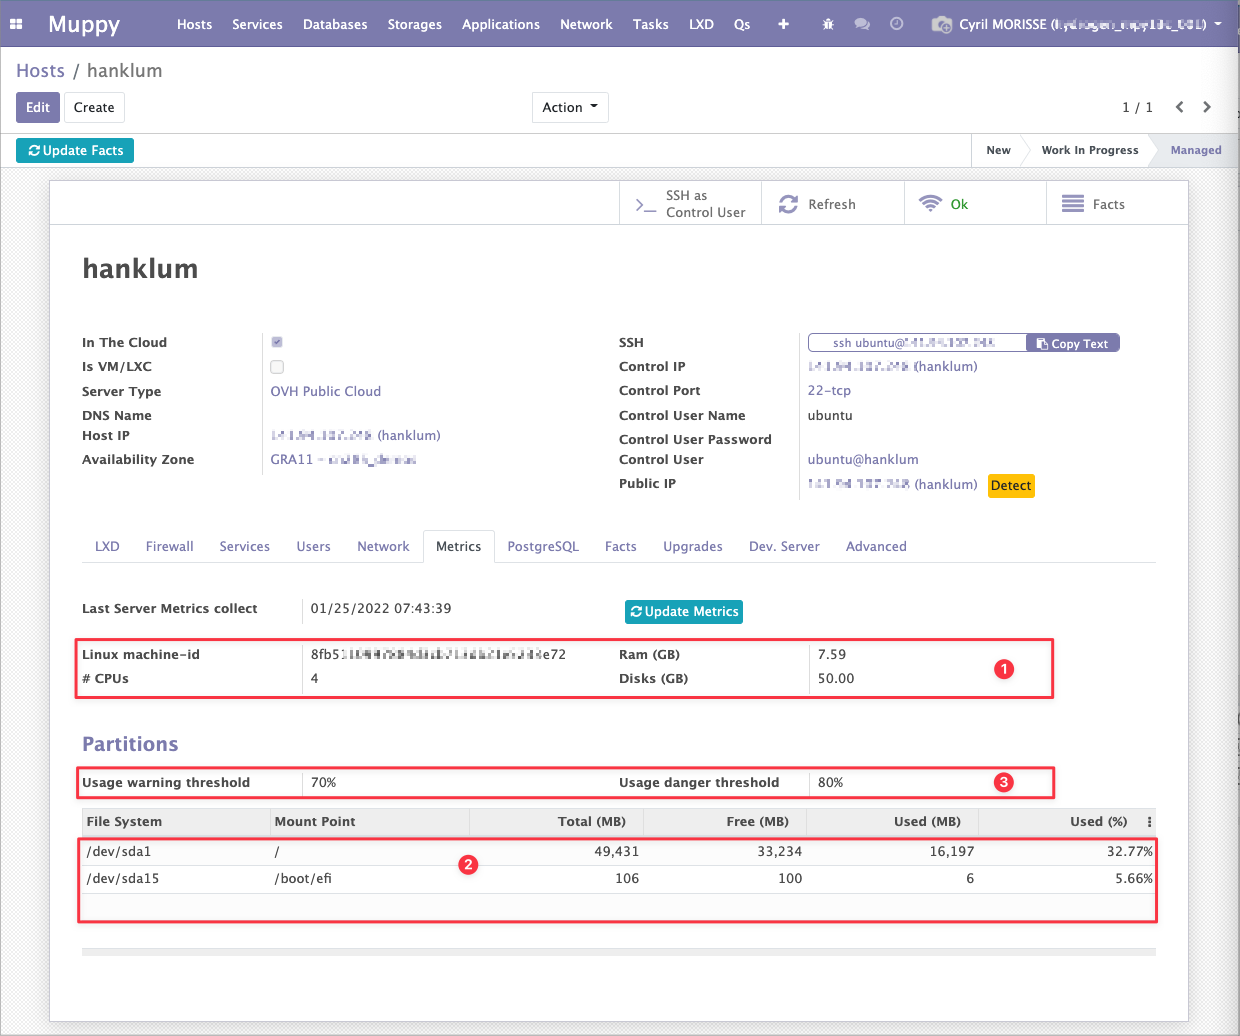
The Update Metrics button (btn_collect_server_metrics) re-collects the metrics on demand. The Last Server Metrics collect timestamp records when the data was last refreshed.
Warning
Muppy is not intended to become a metrics sink (or metrics server). Muppy's metrics collection functions let you quickly set up minimal disk space monitoring.
Host Characteristics
Collection populates the following fields:
| Field | Description |
|---|---|
| Linux machine-id | The server's /etc/machine-id. |
# CPUs (cpu_nb) |
Number of CPUs reported by lscpu. |
Ram (GB) (ram_gb) |
Total memory. |
Disks (GB) (disks_gb) |
Total block-device capacity. |
Info
The benchmarks below need # CPUs to be known, so run Update Metrics at least once before launching them.
Disk Space Notifications
Muppy lets you define 2 thresholds whose breach generates a notification:
- Usage warning threshold (
partition_usage_warning_threshold) — the fraction of used space above which Muppy generates a warning notification. Default: ==70% (0.70)==. - Usage danger threshold (
partition_usage_danger_threshold) — the fraction of used space above which Muppy generates a danger notification. Default: ==80% (0.80)==.
Notifications are generated at the time of Fact collection or Metrics update.

Disabling notifications
To disable disk usage notifications, enter a value greater than 100 (e.g. 999) in the threshold field. Any partition usage above 100% is impossible, so the threshold is never reached and no notification is ever sent.
The Partitions list shows, for each mount point, the file system, total/free/used space and the used percentage. Rows are highlighted in orange (warning) or red (danger) when their usage crosses the corresponding threshold.
Purge Muppy temp folders
The Purge Muppy temp folders button (btn_purge_muppy_temp_folders) reclaims disk space by emptying the Muppy-related temporary directories (under /tmp, /var/tmp, and the PostgreSQL cluster pg_dump temp folder), then re-collects the metrics so the partition figures reflect the freed space immediately.
Performance Benchmarks
The Performance benchmarks group lets you measure the Host's disk and CPU performance.
Info
Both benchmarks run asynchronously (dispatched as IMQ tasks), apt install the required tool on the server before running, and require a prior Metrics collection (they use the # CPUs value).
Disk benchmark (fio)
The Bench disks button (btn_launch_fio_bench) runs a fio random-write benchmark on the server. Results are written back to:
- fio bandwith (Mb/s) (
fio_bw) — measured write bandwidth. - fio write IOPS (
fio_iops) — measured write IOPS.
Optionally set fio bench folder (fio_bench_folder) to force the directory in which fio runs (useful to benchmark a specific mount point). The exact command is shown, copy-pasteable, in the fio bench command (fio_cmd) field:
sudo apt install -y fio && fio --name=rand-write --ioengine=libaio --iodepth=32 --rw=randwrite --invalidate=1 --bsrange=4k:4k,4k:4k --size=512m --runtime=120 --time_based --do_verify=1 --direct=1 --group_reporting --numjobs=<cpu_nb>
CPU benchmark (sysbench)
The Bench CPU button (btn_launch__sysbench) runs a sysbench CPU benchmark on the server. The total number of events is written back to sysbench nb total events (sysbench_total_events).
The --cpu-max-prime field (sysbench_cpu_max_prime) sets the upper limit of the primes generator; Muppy defaults it to ==100000== (vs. sysbench's own default of 10000). The exact command is shown, copy-pasteable, in the sysbench bench command (sysbench_cmd) field:
sudo apt install -y sysbench && sysbench --threads="<cpu_nb>" --cpu-max-prime=100000 cpu run
Collection Schedule
Metrics collection is automated by a standard Scheduled Action (cron): Muppy: Collect All Servers Metrics (cron_collect_all_servers_metrics).
Success
By default, the collection runs once a day, around 06:00 UTC, across all managed physical hosts.